Features
Analytics & reports
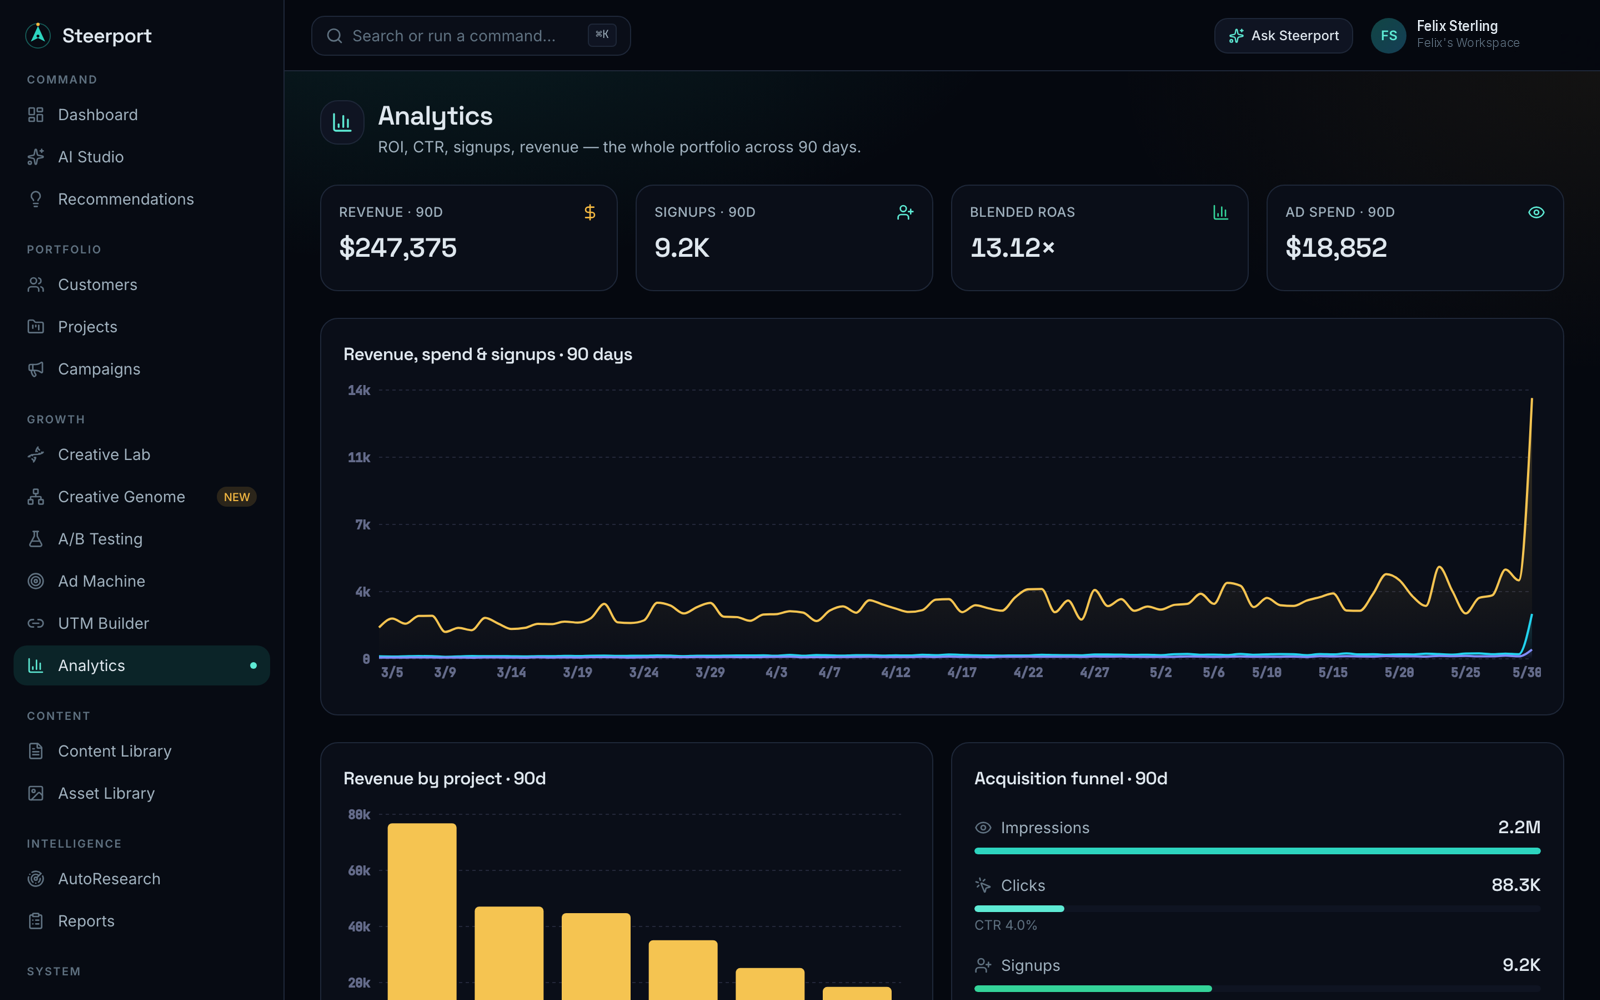
ROI, CTR, signups, and revenue — global, per customer, per project — turned into shareable reports.
The whole portfolio in one glance
Analytics is where the synced data becomes understanding. Steerport rolls up ROI, CTR, signups, and revenue at three levels:
- Global — your entire book of business at once.
- Per customer — how a single brand is performing across its properties.
- Per project — a single app or site, down to the campaign.
The command center surfaces the headline numbers — blended ROAS, spend, active agents, top angles — and Analytics lets you drill in.
Where the numbers come from
Everything here is downstream of your connected accounts and synced performance, attributed by the UTMs on your links. Clean inputs are what make the analytics trustworthy, so keep tagging consistent and accounts linked to the right projects.
Reports
Open Reports to turn performance into something you can hand to a client or stakeholder. Steerport generates a report from the underlying data, and autonomous agents can produce them on a recurring cadence so a fresh report is waiting without you assembling it by hand.
On the Agency plan, reports can be white-labeled and paired with an audit log for client-facing delivery — see Plans & billing.
Turning insight into action
Analytics doesn't just describe the past. The same signals feed the Creative Genome and the recommendations that tell you what to do next — so reading your numbers and improving them are the same loop.